How to create a Breaking Bad Timeline in Tableau
Rajtilak Bhattacharjee
-
November 04, 2019
Now that I had finished the final season of Breaking Bad for the third time, I thought to myself, why not create a Breaking Bad timeline, in Tableau. Here's how I created it the Breaking Bad dashboard in Tableau.
1. Downloaded the background image from the internet
2. Gathered the data from RatingGraph.com, and copy/pasted the entire thing onto an Excel spreadsheet
3. Downloaded the Breaking Bad font from DaFont.com
4. Got the Breaking Bad color palette from SchemeColor.com
While searching for the color palette, I found something else of interest for the Breaking Bad fans. The ‘Breaking Bad’ and Colors: A Comprehensive Guide to the Theories, Costumes. Here is the link to the original article, although it takes years to load and yet, none of the images load correctly.
5. Connected the Excel data into Tableau
6. Created the line graph with the data
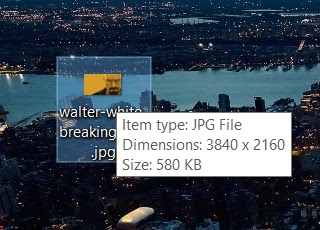
7. To import the image into a Tableau worksheet, find the dimension of the image by hovering your cursor over it's icon
8. Create a new Worksheet called "Image"
9. Create 2 Calculated Fields in Tableau, X and Y with the value of the dimensions of the image. X with be width, Y would be height
10. Now comes to fun part, importing the Breaking Bad wallpaper image into the "Image" worksheet. For that, go to Map > Background images > Sheet1 (or whatever the name of the sheet is)
8. In the "Add Background Image" dialog box, click on browse to add the image
10. For X- and Y-field, select the X and Y calculated fields that we had created in step 9, and click Ok > Apply
11. Adjust the X- and Y-axis bu making them fixed
12. Now, create a dashboard, drag and drop the image as Auto instead of Floating so that it takes up the whole place
13. Now drag and drop the line graph we created in step 6 as Floating
14. Select the graph, click on Format > Shading
15. In "Format Shading" box, select "None" under Worksheet on the Sheet tab
16. Now do the necessary formatting and we have a winner!
The only drawback here is that this is not multi-device compatible. It's best viewed in 1920x1080 rsolution monitor. I will create another dashboard for that. If you find these steps a little overwhelming, feel free to download this Tableau Template from my Tableau profile, and play around with it. Also, if you like this dashboard, or is a Breaking Bad fan like I am, don't forget to upvote this on Reddit, or share it on Fascebook, or any of your favorite Social Media platforms.
Breaking News
Connect on Facebook
Categories
Add-in
Adsense
Alteryx
Android
Apple
Apps
Artificial Intelligence
Blogger
Blogging
Browser
Business Intelligence
Chrome
Coding
Computer Vision
Data Analytics
Data Science
Data Visualization
Deep Learning
Downloads
EDA
Excel
Extension
Firefox
Gaming
Gartner
GitHub
Gmail
Google
Google Domains
Google Sheet
GPT3
Guest Post
How To
Humor
IEEE
Instagram
Interview
iOS
iPhone
Job
Jupyter
Kotlin
Language
Machine Learning
Macro
Mathematics
Medium
Microsoft
Mobile
NLP
Office
Opera
Paid Post
Pandas
Pixel
PowerPoint
Programming
PUBG
Python
R
Reddit
Safari
SAP
Security
Service
Social Media
Tableau
Templates
Tool
Training
VBA
VGG16
Video
Visualization
WhatsApp
Windows
Windows Phone
Word
WordPress


